Reels


SOCIAL MEDIA
METRICS
Client Statistics
When we collaborate with a client, it is crucial to assess their average performance metrics and compare them with the statistics after implementing our management strategies. Here's an illustration:
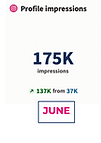
Before our engagement, the client typically received an average of 39,000 impressions. We initiated our partnership with this company in March, and by the fourth month of our collaboration, their impressions soared to a remarkable 365,000 organically, without the use of advertising.


CLIENT YEAR PERFORMANCE
Comparing our clients yearly numbers before our management and then the yearly numbers after our management
From April 2021 – April 2022 (before management) VS March 2022 – March 2023 (After our management)
Client didn't want to use paid ads therefore this was all organic growth.
FROM 116K
IMPRESSIONS TO
3M
FROM 78K
USERS REACHED TO
2M
FROM 688
VIEWS TO
650K
FROM 100
POSTS TO
2.7K